Main panel
The main panel presents an interactive visualization of a network.
Interpretation of a visualization
The interpretation of the visualization of a network can be summarized as follows:
-
Size of an item. The size of an item represents the value of the attribute selected in the Size drop down list on the View tab in the control panel.
-
Color of an item. The color of an item represents the value of the attribute selected in the Color drop down list on the View tab in the control panel.
-
Label of an item. Each item in a network has a label, but to prevent overlap of labels, it is not always possible to display all labels. Labels of items that have a larger size are prioritized over labels of items that have a smaller size. By zooming in on a specific area in the visualization of a network, more labels can be made visible.
-
Thickness of a link between two items. The thickness of a link between two items represents the strength of the link. Links are displayed only if their strength is greater than or equal to the Minimum strength parameter on the View tab in the control panel.
-
Distance between two items. The distance between two items approximately indicates the strength of the link between the items. In general, the stronger the link between two items, the smaller the distance between the items.
-
Horizontal and vertical axes. The horizontal and vertical axes have no special meaning. Rotating or flipping the layout of a network does not affect the interpretation of a visualization.
Example
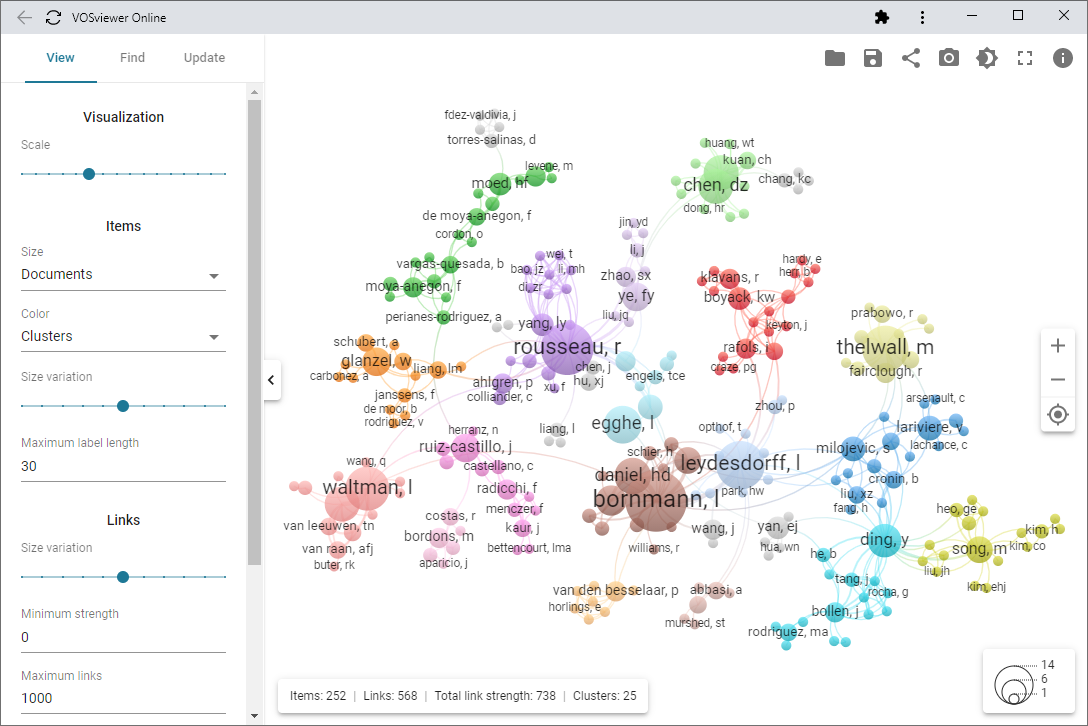
As an example, consider the above visualization of a co-authorship network of researchers. This visualization can be interpreted as follows:
-
Size of a researcher. The number of documents authored by a researcher.
-
Color of a researcher. The cluster to which a researcher belongs. A cluster is a group of researchers with a relatively large number of co-authored documents. The larger the number of documents co-authored by two researchers, the more likely the researchers are to belong to the same cluster.
-
Thickness of a link between two researchers. The number of documents co-authored by two researchers.
-
Distance between two researchers. The distance between two researchers approximately indicates the number of documents co-authored by the researchers. In general, the larger the number of documents co-authored by two researchers, the smaller the distance between the researchers.