Control panel
The control panel consists of the following tabs:
-
View. Use this tab to make adjustments to the visualization of a network in the main panel.
-
Find. Use this tab to find an item in the visualization of a network in the main panel.
-
Update. Use this tab to update the layout and clustering of the network visualized in the main panel.
View
The View tab can be used to make adjustments to the visualization of a network in the main panel.
Visualization
Scale

The Scale slider determines the scale of the visualization of a network. The higher the value of the slider, the larger the size of the items in the visualization and the thicker the links between the items.
Items
Size

Use the Size drop down list to select the attribute that determines the size of items in the visualization of a network.
Color

Use the Color drop down list to select the attribute that determines the color of items in the visualization of a network.
Size variation

The higher the value of the attribute selected in the Size drop down list, the larger the size of an item in the visualization of a network. The Size variation slider determines the strength of this effect.
Maximum label length

The Maximum label length parameter determines the maximum length of a label displayed in the visualization of a network. If the length of the label of an item exceeds the maximum length, only the first part of the label is displayed.
Links
Size variation

The stronger the link between two items, the thicker the link in the visualization of a network. The Size variation slider determines the strength of this effect.
Minimum strength and Maximum links
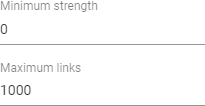
The Minimum strength and Maximum links parameters determine, respectively, the minimum strength of the links displayed in the visualization of a network and the maximum number of links displayed in the visualization of a network. If the number of links that have the minimum strength exceeds the maximum number of links to be displayed, only the strongest links are displayed.
Curved links

The Curved links switch determines whether links have a straight or a curved shape in the visualization of a network.
Color schemes
Cluster colors
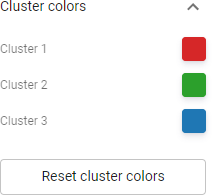
When an attribute with categorical values (i.e., clusters) is selected in the Color drop down list, the Cluster colors options can be used to adjust the color scheme for coloring the items in the visualization of a network.
Score colors

When an attribute with continuous values (i.e., scores) is selected in the Color drop down list, the Score colors drop down list can be used to select a color scheme for coloring the items in the visualization of a network. Eight color schemes are available.1 The default color scheme is Viridis.
Find
The Find tab can be used to find an item in the visualization of a network in the main panel.
Use the Find item text field to find an item in the network visualized in the main panel. Click on the item to zoom in on the item in the visualization of the network.
Update
The Update tab can be used to update the layout and clustering of the network visualized in the main panel.2
Rotate / flip
Rotate

Use the Rotate button to rotate the layout of a network. The Degrees to rotate parameter determines the number of degrees by which the layout is rotated.
Flip horizontally

Use the Flip horizontally button to flip the layout of a network in horizontal direction.
Flip vertically

Use the Flip vertically button to flip the layout of a network in vertical direction.
Normalization
Normalization method

Use the Normalization method drop down list to determine how the strength of the links between the items in a network is normalized in the layout and clustering techniques used by VOSviewer Online:
-
No normalization. Do not perform a normalization. In general, this is not recommended.
-
Association strength. Use the association strength normalization method. Apart from a multiplicative constant, this method is identical to Eq. (6) in Van Eck and Waltman (2009). This option is selected by default.
-
Fractionalization. Use the fractionalization normalization method. Apart from a multiplicative constant, this method is identical to Eq. (13) in Van Eck and Waltman (2009).
-
LinLog/modularity. Use the same normalization as in the LinLog layout technique and the modularity clustering technique. For more information about these techniques, see Newman (2004), Noack (2007), and Noack (2009).
Layout
Attraction and Repulsion
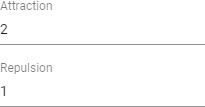
Use the Attraction and Repulsion parameters to adjust the layout of a network. The parameters must have a positive or negative integer value, typically between -2 and 2. The Attraction parameter must have a higher value than the Repulsion parameter. In most cases, it is recommended to set the Attraction and Repulsion parameters to values of 2 and 1, respectively. Values of 2 and 0 or 1 and 0 may also yield a good layout.
Advanced parameters
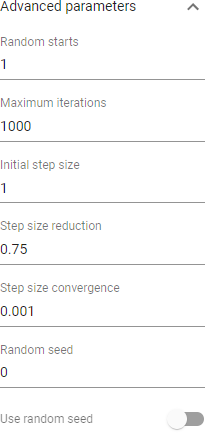
In general, it is recommended not to change the values of the advanced parameters of the layout technique used by VOSviewer Online.
Update layout

Use the Update layout button to update the layout of a network.
Clustering
Resolution

The Resolution parameter determines the level of detail of the clustering of a network. The parameter must have a non-negative value. The higher the value of the parameter, the larger the number of clusters in the clustering of a network. It is recommended to try out different values for the Resolution parameter and to use the value that yields the most useful clustering.
Minimum cluster size

The Minimum cluster size parameter determines the minimum size of a cluster in the clustering of a network. Each cluster should include at least the minimum number of items specified by this parameter.
Merge small clusters

The Merge small clusters switch determines how small clusters, which do not include the minimum number of items specified by the Minimum cluster size parameter, are handled. If the switch is turned on, small clusters are merged into larger clusters. Otherwise small clusters are discarded.
Advanced parameters
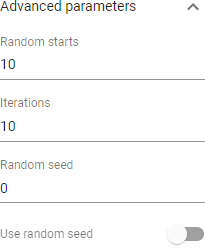
In general, it is recommended not to change the values of the advanced parameters of the clustering technique used by VOSviewer Online.
Update clustering

Use the Update clustering button to update the clustering of a network.
-
The color schemes available in VOSviewer Online have been obtained from Matplotlib, a plotting library for Python. Some color schemes have been slightly adjusted. For more information, see the Matplotlib website and this blog post. ↩
-
For more information about the layout and clustering techniques used by VOSviewer Online, see Van Eck et al. (2010), Waltman et al. (2010), Van Eck and Waltman (2014), and Traag et al. (2019). ↩